Log Indexing and Analysis with Logstash and Kibana
I was back on HiFi today after one of our servers went through a minor panic attack.
Memory pressure led to swapping, swapping lead to thrashing, and thrashing led to the dark side where the ready queue was briefly in excess of the number of the machine's cores by a factor of 10. The interruption was brief, but it lead to thinking about low hanging fruit, bottlenecks, and ops.
I've been thinking a lot about twelve-factor app development and deployment lately. The "Twelve-Factors" are a set of principles put together by Adam Wiggins of Heroku fame. Following the methodology takes some additional thought and effort upfront, but has a lot of upside once you're operational. One of the factors concerns logging:
Most significantly, the stream can be sent to a log indexing and analysis system such as Splunk, or a general-purpose data warehousing system such as Hadoop/Hive. These systems allow for great power and flexibility for introspecting an app’s behavior over time, including:
- Finding specific events in the past.
- Large-scale graphing of trends (such as requests per minute).
- Active alerting according to user-defined heuristics (such as an alert when the quantity of errors per minute exceeds a certain threshold).
I've been meticulous about the maintenance and archival of HiFi's data logs. We have used them in retrospectives and the occasional in-depth analysis, but have stopped short of putting together a system for harvesting and inspecting the data interactively. Today's incident was motivation to set one up.
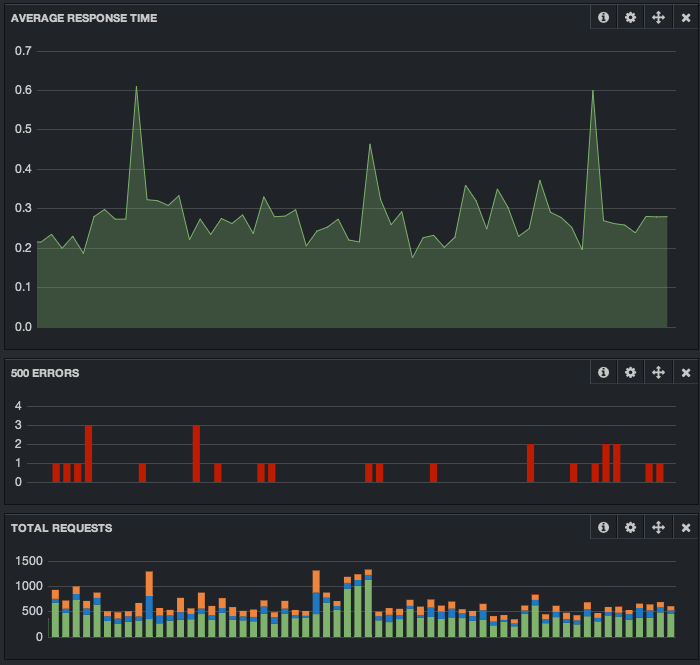
The triumvirate of Logstash, Kibana, and elasticsearch came up in a recent Hacker News thread sounded encouraging. Logstash is a flexible event log streamer that makes it simple to extract data from logs and get it into elasticsearch for indexing and analysis (it can do a lot of other neat things, too). Kibana is a beautiful web interface for creating interactive dashboards for your data in elastic search. It's an all HTML5 application running entirely in the browser using elasticsearch's rest API. It's easy to make good looking dashboards:

Getting kibana, logstash, and elasticsearch running only took an afternoon to install and configure after running through logstash's Getting Started Guides. I'll need to come back for some additional work (like purging data) after it's fully proven itself. My initial impression: it's great collection of software.
Ignoring the per-server JVM bloat required by logstash, the whole setup seems too good to be true. Especially for open source software. It's simple to get logstash configured and kibana/elastic search are impressive (and fun!) to work with interactively. Diving in to specific events, isolating classes of events (like 500 errors), and composing dashboards to quickly answer your key questions is powerful.
Warehousing, visualizing, and diving into log data has never been easier. Now I just want to log more.
